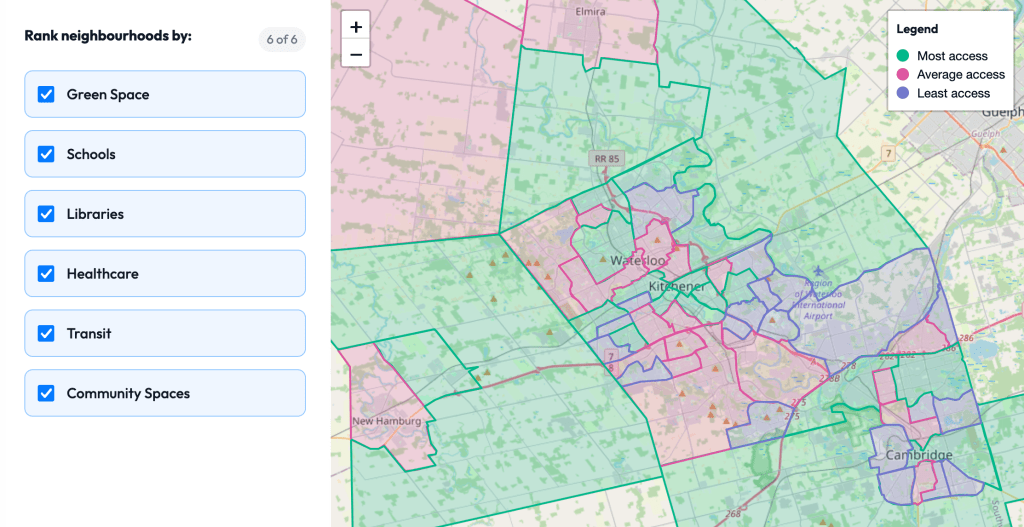
Neighbourhood Services Map
This map shows the level of access to services like parks, green space, transit, healthcare, and community space. Which neighbourhoods have abundant access? Which ones need more investment?
Our vision includes a number of measurable outcomes. These are indicators that we can measure and track to make sure we’re on the right path towards achieving this vision. Some indicators are already being monitored by government, academia, or non-profit organizations in our community. Some are brand-new indicators that arose out of our roundtable discussions. As we continue to grow, measuring our progress will be ever more important to non-profits and community organizations.
We are currently seeking partners to help us communicate these indicators, collect data, and work with government- and community-led open data initiatives. If you’re interested in getting involved, email us at connect@holdthelinewr.org.
Arts, culture & sport
- Awareness of local artists, athletes, venues, and events (audience survey)
- Number of free community arts, culture, and sporting events (by neighbourhood)
- Number of visitors in the local hospitality sector
- Municipal Accommodation Tax revenue collected
- Per-capita funding for arts and athletics in Waterloo Region
- Participation of racialized artists and athletes
- Employed / financially stable artists in the region
- Number of residents with Artist as their primary occupation
- Number of ticketed events
Belonging
- Rate of volunteerism (formal and informal)
- Number of neighbours people recognize and know by name
- Levels of child well-being
- Number of childcare spaces (by neighbourhood)
- Number of seniors’ assisted living facilities (by neighbourhood)
- Instances of gender-based violence
- Rate of domestic labour and caregiving
- Reported rates of suicidal ideation
- Self-reported levels of belonging [Canadian Index of Wellbeing]
- Voter turnout at municipal, provincial, and national levels
- Gap in percentage turnout between older and younger voters [Canadian Index of Wellbeing]
- Percentage of children aged 0 to 5 years for whom there is a regulated centre-based child care space [Canadian Index of Wellbeing]
- Percentage of population living in poverty (based on Low Income Measure After Tax LIM-AT) [Canadian Index of Wellbeing]
- Average daily amount of time spent with friends (minutes per day) [Canadian Index of Wellbeing]
- Rate of bullying [Children and Youth Planning Table Youth Impact Survey]
- Participation in civic activities [Children and Youth Planning Table Youth Impact Survey]
- Participation in public consultation activities
Climate action
- Rate of energy use from local sources, and from zero-emission sources
- GHG emissions (by sector) [SWR, CIW]
- Waste diversion percentage
- Diversion of Organics [SWR]
- Number of buildings constructed to passive house standards
- Proportion of zero-emission vehicles (personal and commercial)
- Proportion of food wasted in homes and in businesses
- Electrical Vehicle Ownership [SWR]
- Number of people working in green jobs
Disability justice
- Proportion of fully accessible public spaces (indoor and outdoor)
- Diversity of participants, creators, and collections in arts and culture institutions
- Proportion of transit stops with curb cuts, shelters, and non-visual schedule information (by neighbourhood)
- Representation of people with disabilities in policy decisions and implementation
- Number of public events with sign language interpreters and live captions
- Time spent on waitlist for accessible public housing
- Proximity of accessible housing to transit, healthcare, and essential services
- Use of universal design principles in new public buildings and spaces
- Budget allocation for implementation of accessibility improvements
- Ratio of ODSP shelter allowance compared to median market rent
- Rates of medical assistance in dying (MAID) due to poverty
Education
- Attendance rate (by race, income, language, gender, special populations)
- Participation in extracurricular activities, clubs, and student leadership
- Gap in graduation rates and academic achievement (by ethnicity, income, language, disability, and gender)
- Teacher retention and turnover rates
- Staff diversity rates relative to student population
- Post-secondary persistence and completion rates
- Alumni tracking for wage data or employment in field of study
- Family participation in school events, parent-teacher conferences
- Percentage of teachers with certifications or advanced degrees; ongoing professional development hours per educator
- Number of partnerships between K-12 schools and local organizations, businesses, or postsecondary institutions
- Access to multilingual resources and culturally responsive communication
- Ratio of students to educators in public schools [Canadian Index of Wellbeing]
- Number of post-secondary students who stay in Waterloo Region after graduation
- Level of education
Environment
- Rate of groundwater recharge
- Water quality in our watershed’s rivers and creeks
- Concentrations of road salt, fertilizers and mining by-products in the environment
- Biodiversity (count number of species)
- Tree canopy coverage (by neighbourhood)
- Rate of children diagnosed with asthma or other air quality related illnesses
- Number of hectares protected by Conservation Authorities, municipal/provincial/national parks, conservation easements, land trusts, and other environmentally-sensitive areas
- Rates of participation in outdoor recreation & sport
- Vehicle kilometres travelled (by transportation method)
- Total km of roadways vs multi-trails and sidewalks
- Air Quality [Canadian Index of Wellbeing]
- Grand River downstream water quality
Food
- Number of productive farms in WR (by crop)
- Total farmland [Canadian Index of Wellbeing]
- Rate of food bank usage (by demographic group)
- Rate of food insecurity (by neighbourhood)
- Number of community gardens and greenhouses
- Number of children served through school food programs
- Percentage of population that is moderately or severely food insecure [Canadian Index of Wellbeing]
Health
- Availability of emergency rooms, urgent care clinics, and walk-in clinics (by neighbourhood)
- Reduction in 911 calls
- Levels of anxiety, mental well-being (survey)
- Number of emergency room visits for mental health & addictions (by neighbourhood)
- Number of people on waitlist for mental health care
- Number of people on waitlist for primary care physician
- Overall health outcomes (by neighbourhood)
- The gap between life expectancy and health outcomes in the richest and poorest neighbourhoods has significantly reduced.
- Percentage of population that received influenza immunization in past year [Canadian Index of Wellbeing]
- Percentage of population with a regular medical doctor [Canadian Index of Wellbeing]
- Percent of children vulnerable, Physical Health & Well-Being [Early Development Instruments]
- Percent of children vulnerable, Emotional Maturity [Early Development Instruments]
- Out-of-pocket costs for healthcare, including mental health
Housing
- Average housing costs vs. income (by neighbourhood, tenure, and age of housing)
- Distribution of homes by number of bedrooms, number of units, and built form (by neighbourhood)
- Number of homes in non-market housing (by neighbourhood)
- Number of neighbours experiencing homelessness, including hidden homelessness (by demographic group)
- Number of people who own multiple homes
- Rate of housing insecurity
- Percentage of households paying 30% or more of average monthly household income on housing [Canadian Index of Wellbeing]
- Percentage of youth experiencing homelessness or hidden homelessness [Children and Youth Planning Table Youth Impact Survey]
Indigenous sovereignty
- Use of data collection and research methods that honour Indigenous data sovereignty
- Use of Indigenous-developed evaluation methods (e.g., Two-Eyed Seeing, community-based indicators)
- Feedback from Indigenous partners on the quality of relationship and mutual respect
- Number of Indigenous people in decision-making roles
- Training provided to non-Indigenous service providers on decolonization, anti-racism, and Indigenous rights
- Hectares of land returned, protected, or transferred to Indigenous governance
- Prevalence of Indigenous place names and languages in public signage and documentation
- Number of organizations that have integrated Indigenous knowledge systems into curriculum, research, and planning processes
- Workforce participation rates for Indigenous peoples in leadership roles
- Contracts awarded to Indigenous-owned businesses
Labour
- Rate of poverty (by demographic group and neighbourhood)
- Number of gig workers (by industry)
- Number of living wage employers
- Number of people working multiple jobs (by neighbourhood)
- Number of workers injured or killed
- Proportion of tenured teaching staff at post-secondary institutions
- Post-secondary funding for operational expenses, net of tuition
- Number of locally-owned employers (profit stays in community)
Multiculturalism
- Rate of onward migration (immigrants who leave within 5 years)
- Number of hate crimes and reports of discrimination (by demographic group)
- Rate of foreign-trained professionals working in their field (survey)
- Number of ethnocultural groups with dedicated, permanent meeting/gathering space
- Wait time for refugee claims
- Social mobility for second-generation neighbours (ability to improve relative to their parents)
Organizational capacity
- Land and buildings owned by co-ops, First Nations, unions, and land trusts
- Number of social enterprises owned by non-profits, charities, co-ops, and First Nations
- Increase in permanent, full-time staff receiving a living wage in the non-profit sector
- Amount of time spent on grant-writing vs. grant funds received (grant acquisition success rate)
- Number of joint programs and shared resources between organizations (level of collaboration)
- Number of stakeholders involved in an organization (clients, participants, volunteers, donors, staff)
- Number of significant stories of impact (by sector)
- Proportion of revenue from government, philanthropy/sponsorship, and other revenue
- Gap in compensation and benefits between non-profit, government, and private sector
- Operating reserves (e.g., number of months of expenses covered)
- Number of people on waitlists for daycare, co-op housing, studio spaces, therapy, primary care, trans healthcare, etc.
- Percentage of organizations participating in citywide strategic planning efforts or cross-sector partnerships
- Funds available to support capacity-building (not just programs)
- Staff retention rates in non-profit organizations
- Number of non-profit leadership development programs in Waterloo Region
- Geographic service coverage by sector (which neighborhoods are underserved?)
- Percentage of population volunteering for a charitable or non-profit organisation [Canadian Index of Wellbeing]
- Percentage of population that made a donation in the past year to a charitable or non-profit organisation [Canadian Index of Wellbeing]
- Total amount of charitable contributions
- Ratio of director-level compensation vs lowest paid employees
- Number of meeting spaces which do not charge a booking fee
Public spaces
- Green space per capita (by neighbourhood)
- Capacity vs. actual usage of public spaces like libraries, community centres, places of worship, schools
- Number of commercial, employment, recreational, and community amenities (by neighbourhood)
- Vacancy rate, residential and commercial (by neighbourhood)
- Rate of neighbourhood stability (residents staying in neighbourhood after 5, 10, 20, 50 years?)
- Number of sport facilities (by neighbourhood)
- Number of bookable community spaces (by neighbourhood)
- Number of rent-free meeting spaces (by neighbourhood)
- Number of schools, community centres, parks, and libraries (by neighbourhood)
Transportation
- Number of children walking or biking independently to school
- Number of neihgbourhoods achieving transit-supportive density
- Proportion of trips taken by active transportation, transit (by neighbourhood)
- Transit service levels: frequency, coverage, reliability (by neighbourhood)
- Walkability and safe pedestrian infrastructure (by neighbourhood)
- Percentage of population 15 years and older with long commutes to work (over 45 minutes) [Canadian Index of Wellbeing]
